
Running performance max and Facebook ads together is no longer an advanced strategy. For Shopify brands doing $50K to $5M per month, it's the default paid acquisition stack. The brands winning in 2026 are not picking one platform over the other. They're treating Meta and Google as two halves of one system, managing the whole thing by blended MER and incrementality instead of chasing channel-specific ROAS that platform dashboards serve up.
The problem is that most DTC brands still run these platforms in complete isolation, make budget decisions based on last-click ROAS, and wonder why scaling to $300K/month in ad spend feels like pushing a boulder uphill. This article gives you the operating system to fix that.
Key Takeaways
- Google's 2023 data shows retail advertisers using Performance Max with Shopping feeds achieved 18% more conversions at similar CPA vs. Standard Shopping, and Meta's Q4 2024 earnings revealed ad impressions up 21% year-over-year, meaning both platforms are getting stronger simultaneously.
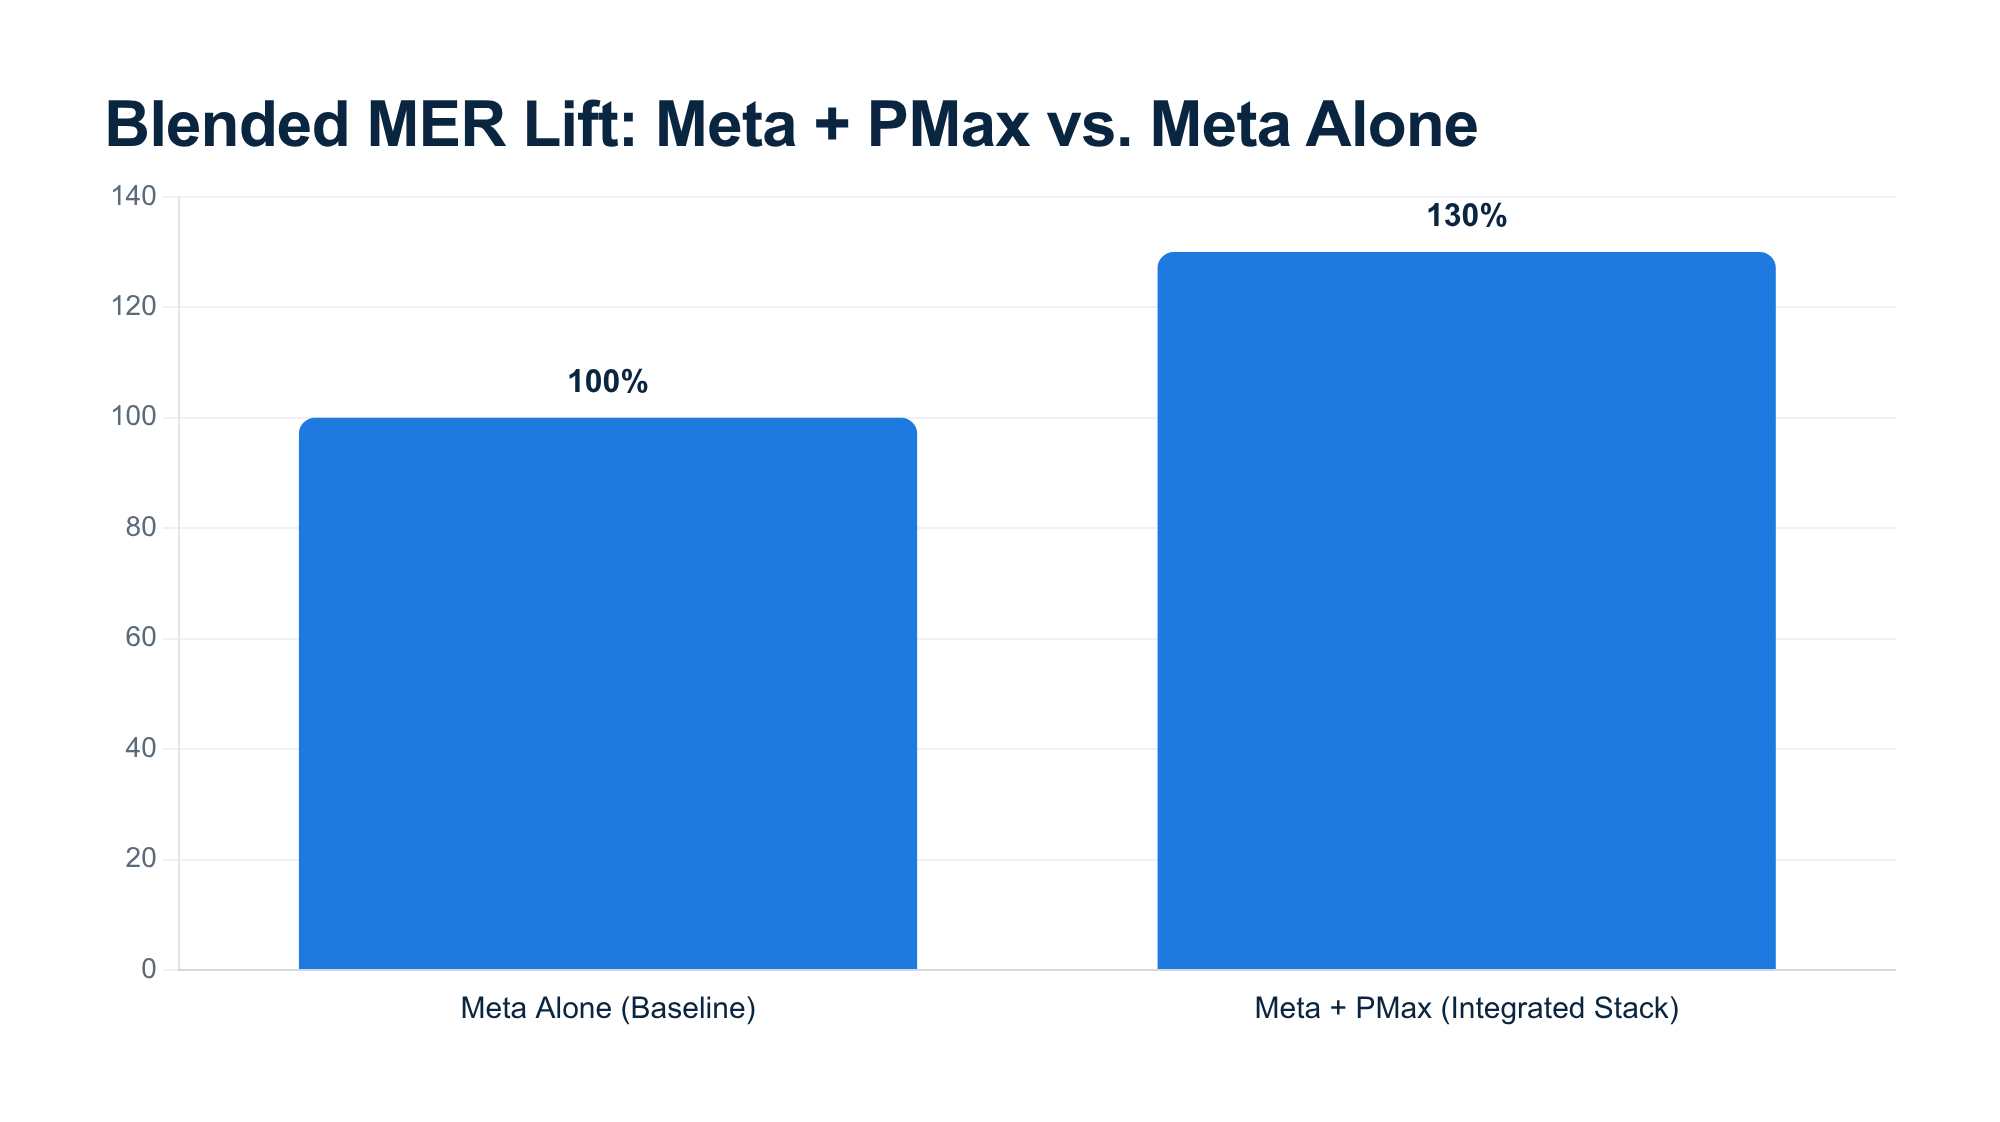
- Agency benchmarks across 2024-2025 DTC accounts consistently show 20-40% higher blended MER when Meta prospecting runs alongside PMax versus Meta alone, because PMax harvests the demand Meta creates.
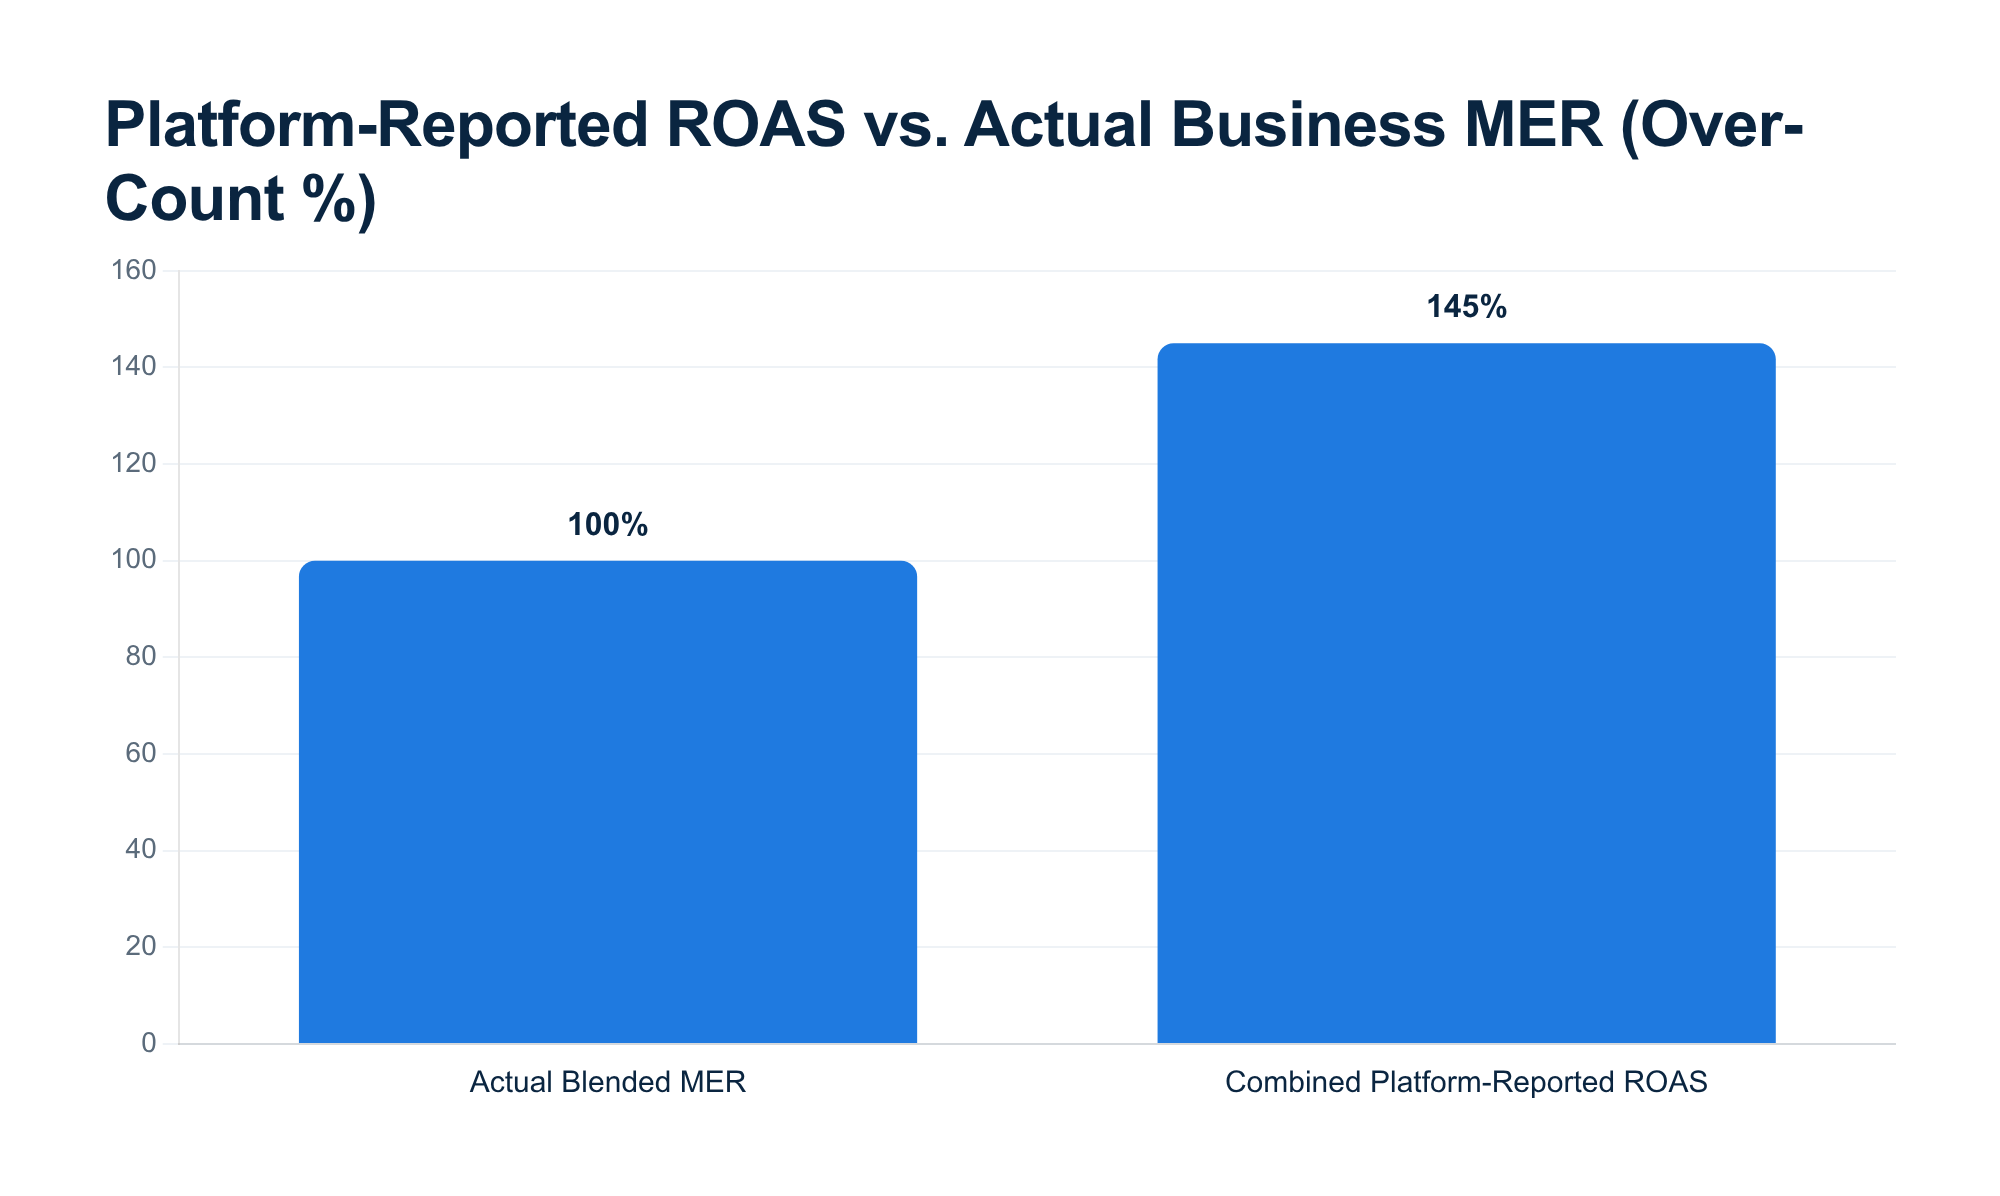
- Platform-reported ROAS across Meta and Google simultaneously routinely exceeds actual business MER by 30-60% due to duplicate conversion counting, making blended MER based on Shopify revenue the only reliable metric for cross-channel budget decisions.
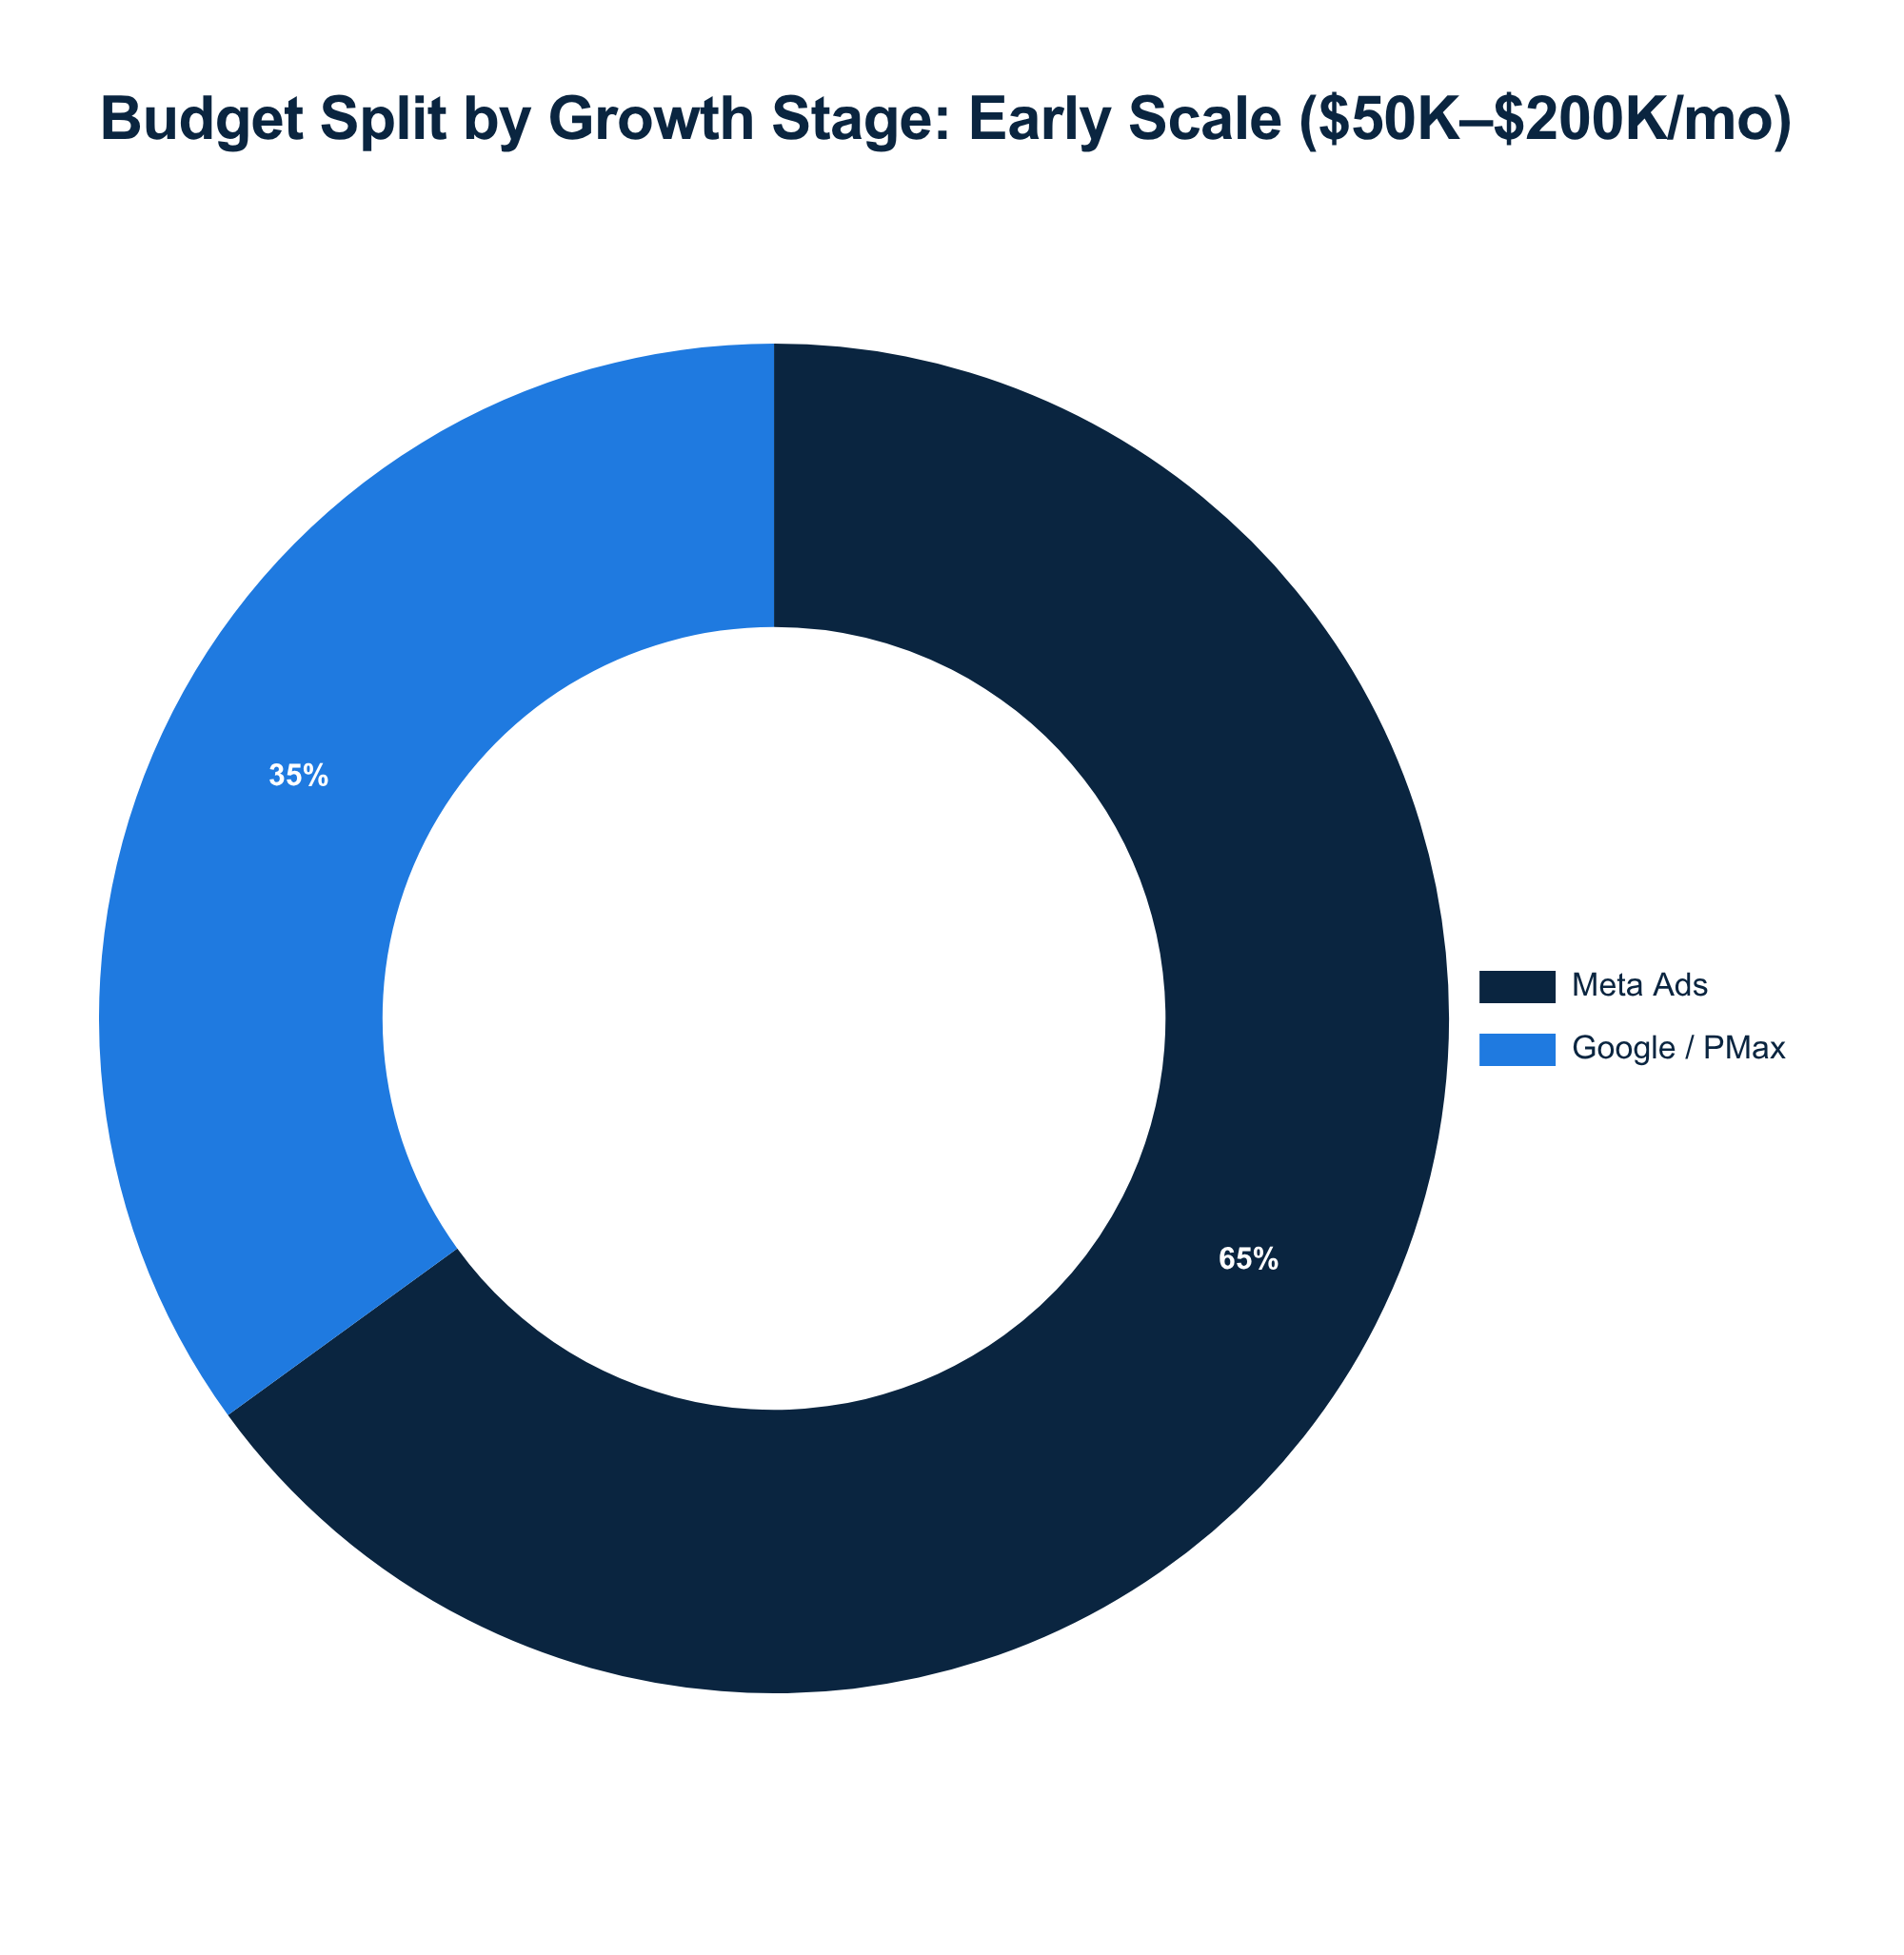
- Early-stage Shopify brands under $200K/month should allocate 60-70% of paid media budget to Meta and 30-40% to Google (PMax plus branded search); growth-stage brands at $200K-$1M+/month typically stabilize near a 50/50 split.
- DTC brands with email and SMS contributing 25-40% of total revenue can sustain 20-30% higher paid CAC while maintaining the same contribution margin as brands without retention infrastructure.
Why Performance Max and Facebook Ads Are the Default DTC Growth Stack in 2026
The Meta and PMax combo dominates because each platform specializes in a different stage of the buyer journey. Meta creates demand. PMax captures it. Running them separately and obsessing over channel-specific ROAS causes brands to systematically under-invest in PMax (letting competitors steal branded searches) or under-invest in Meta (starving the top of funnel and giving PMax nothing to harvest).
Both platforms are getting stronger, not weaker. Google's 2023 internal data showed retail advertisers using Performance Max for online sales achieved an average 18% increase in conversions at similar CPA compared to Standard Shopping. Meta's Q4 2024 earnings showed ad impressions up 21% year-over-year and average price per ad up 6% year-over-year, with ecommerce and DTC brands driving a significant share of that growth.
The Demand Generation vs. Demand Capture Framework
Meta (Facebook and Instagram) generates latent demand and plants purchase intent in cold audiences. Performance Max harvests that intent when those same users later search on Google, browse YouTube, check Gmail, or scroll Discover.
Without Meta feeding the top of funnel, PMax cannibalizes branded traffic but creates nothing new. The audience pool shrinks, costs rise, and growth stalls. Without PMax, users who saw your Meta ad and went to Google to search your product name buy from a competitor's Shopping ad instead. You paid for the awareness and someone else got the conversion.
What the Data Says About Running Both Platforms Together
The business case for the integrated stack is concrete. Agency benchmarks from 2024-2025 consistently report 20-40% higher blended MER when Meta prospecting runs alongside PMax versus Meta alone. For most Shopify brands, Meta drives 60-80% of first-touch clicks while PMax plus branded search captures 40-60% of last-click revenue, particularly from users who saw a Meta ad and then searched.
These numbers tell you something important: neither platform is optional if you want to scale efficiently.
The Biggest Misconception Killing Shopify ROAS Right Now
The most common fear: "If I turn on PMax, my Meta ROAS will drop." This is expected and it is not a problem. Last-click attribution gives Google credit for conversions Meta assisted. A reported Meta ROAS drop from 3.0 to 2.1 after launching PMax is not a failure if blended MER, total revenue, and contribution margin all improved.
This is called controlled ROAS compression. As you scale from $30K to $300K/month in ad spend, your ROAS should compress. The sophisticated question is not "how do I keep ROAS flat" but "what is the minimum acceptable ROAS at my target MER and margin, and how close am I to that floor."
Role Separation: Exactly What Each Platform Should Do in Your DTC Stack
Clarity on role separation is what separates brands that scale from brands that oscillate. Each platform has one job. Give it that job and measure it correctly.
How to Structure Meta Ads for Maximum Demand Generation
Meta's job in 2026 is pure demand generation. Use Advantage+ Shopping Campaigns with purchase as the optimization event for broad prospecting. Run one manual Sales campaign alongside it with three ad sets: Broad (no detailed interests, ages 18-65), LAL 1% purchasers from the last 180 days, and LAL 3% purchasers.
Creative must map to all five stages of buyer awareness. Pattern-interrupt hooks and relatable pain points for problem-unaware cold audiences. UGC-style "this sucked until I found X" testimonials for problem-aware audiences. Feature demos and comparisons for solution-aware. Offer and urgency ads for most-aware. In 2026, at least 50% of Meta spend should be on UGC or testimonial-driven creative based on current performance norms.
Meta Advantage+ Shopping Campaigns show a 12% lower CPA and 15% higher ROAS on average compared to business-as-usual setups per Meta's internal case studies from 2023-2024.
Pro Tip: Do not stack multiple interest layers on Meta in 2026. Broad targeting with a strong creative and purchase optimization lets Meta's algorithm find buyers you would never identify manually, and it outperforms interest-stacked audiences at scale in most DTC verticals.
How to Configure Performance Max for Shopify DTC
Run two PMax campaigns. One Brand and High-Intent campaign with customer list audience signals and site converters. One Non-Brand Prospecting campaign with in-market and custom-intent segments built from competitor URLs and relevant category topics.
Feed quality drives PMax performance more than bidding adjustments. Optimize Merchant Center feed titles with keyword-rich descriptions that include benefits, not just product names. Use high-resolution in-use product images. Keep pricing and availability synced via the Shopify to Merchant Center integration. For assets, include 5-10 headlines, 3-5 descriptions, 5 or more images, and at least one video.
For bidding, start with Maximize Conversion Value and a target ROAS set slightly below your historical Shopping ROAS. This gives PMax room to explore non-brand inventory instead of locking into the cheapest, easiest branded conversions. Review performance every seven days. Do not make daily bid changes.
Preventing Audience Overlap, Attribution Double-Counting, and Over-Retargeting
This is the gap no competitor article covers. When Meta and PMax both target the same user simultaneously, you inflate conversion counts and distort ROAS reporting across both platforms.
Three tactics prevent this. First, use Meta's custom audience exclusions to suppress recent PMax converters from seeing Meta ads. Second, set PMax audience signals to focus on prospecting segments rather than broad retargeting pools that overlap with Meta's remarketing. Third, use Shopify's order tagging or a third-party attribution tool to identify which platform reported the same conversion.
The last-click problem is structural. It cannot be fixed without first-party data. Platform-reported ROAS across Meta and Google simultaneously routinely exceeds actual business MER by 30-60% in multi-platform DTC accounts due to duplicate conversion counting.
The Cross-Channel Budget Split Framework: How to Allocate Spend by Growth Stage
Blended MER is the marketing efficiency ratio, defined as total revenue divided by total ad spend across all paid channels. It is the single most reliable metric for cross-channel budget decisions because it uses Shopify revenue as the source of truth rather than platform-reported attribution.
Budget allocation between Meta and PMax should be determined by growth stage, marginal MER per channel, and whether you are in demand-creation or demand-harvesting mode. Not by gut feel or platform rep recommendations.
Budget Split Rules by Revenue Stage
| Revenue Stage | Meta Budget % | Google/PMax Budget % | Key Condition or Trigger |
|---|---|---|---|
| Early Scale: $50K-$200K/mo | 60-70% | 30-40% | Meta is primary demand driver; PMax audience pools still small |
| Growth Stage: $200K-$1M/mo | 50% (flex 40-60%) | 50% (flex 40-60%) | PMax showing non-brand conversion volume; audience signals mature |
| Scale Stage: $1M+/mo | 40-60% based on marginal MER | 40-60% based on marginal MER | Weekly MER reallocation routine driving all decisions |
| MER above target band | Increase total spend 10-20% | Allocate 60% of increment to Meta, 40% to PMax | Signal that the market can absorb more spend profitably |
The Weekly Budget Reallocation Routine
This five-step routine is the operational heartbeat of a profitable dual-platform strategy. Run it every Monday.
Pull last 7 days combined spend and Shopify revenue. Add Meta spend and Google spend together. Pull total revenue directly from Shopify dashboard, not from either platform's reporting. Calculate blended MER by dividing Shopify revenue by total ad spend.
Calculate new customer revenue separately. Use Shopify order tagging, a post-purchase survey tool, or a first-party attribution platform to isolate revenue from first-time buyers. New customer CAC is the metric that tells you whether you are actually growing or just recycling existing buyers.
Compare 7-day CPA and ROAS against your 28-day baseline per channel. If Meta's 7-day CPA is 20% above its 28-day baseline, that is a signal of creative fatigue or audience exhaustion, not a budget problem. If PMax's 7-day CPA is elevated, check the brand versus non-brand conversion ratio before cutting budget.
Adjust budgets based on MER band. If MER is above your target (for example, above 3.5) and operations can handle volume, increase total spend by 10-20% and allocate 60% of that increment to Meta, 40% to PMax. If MER is below target (below 3.0), cut the underperforming channel by 10-20% or hold budgets and fix creative before scaling.
Never change individual campaign budgets more than 20% in a single adjustment. Increases beyond 20% in a single change trigger learning phase resets on both Meta and Google, causing short-term CPA spikes that make performance look worse than it is. Wait at least 3 days between budget adjustments per scaling guidance from Digital Darts.
Setting Your MER Target Before You Touch a Single Budget
Reverse-engineer your MER target from gross margin and contribution margin goals before you allocate a single dollar. Here is the math: if your gross margin is 60% and you need 20% contribution margin after ad spend, your maximum allowable ad cost as a percentage of revenue is 40%, which means your MER floor is 2.5.
DTC brands in 2023-2025 agency benchmarks that maintain MER of 2.5-4.0 represent the profitable scaling range across combined Meta and Google spend. MER below 2.0 signals unprofitable scale. MER above 4.0 often signals under-investment in growth channels, meaning you are leaving revenue on the table.
Pro Tip: A pattern observed consistently across DTC accounts: increasing Meta prospecting spend 30-50% while adding PMax produces 10-25% higher total revenue with MER flat or slightly up, even as Meta's reported ROAS drops 10-20%. The reported ROAS drop is an attribution artifact, not a business problem.
Incrementality Testing: How to Prove Which Platform Is Actually Driving Revenue
Incrementality testing is the process of measuring the true lift a paid channel generates by comparing performance in a region or audience exposed to ads versus a holdout group that is not. It is the gold standard for proving which platform is actually driving revenue versus claiming credit for conversions that would have happened anyway.
Platform-reported ROAS is structurally misleading. Meta uses view-through and click attribution. Google uses last-click. Both claim credit for the same conversion when a user sees a Meta ad and later clicks a PMax Shopping result. Without incrementality testing, you are making budget decisions on corrupted data.
How to Run a Geo-Split Holdout Test for Meta vs. PMax
Identify 2-3 geographic regions (states or DMAs) that represent 10-20% of your revenue but mirror your overall customer profile in AOV, conversion rate, and product category mix. Avoid your highest-revenue markets for the holdout to minimize risk.
Pause Meta ads entirely in the holdout region for 2-4 weeks while keeping PMax running normally in both holdout and control regions. Do not make any other changes to creative, offers, or budgets during the test period.
Compare new customer acquisition rate, revenue per capita, and blended MER in the holdout region versus the control region. You are looking for meaningful differences in new customer rate, not just total revenue, because total revenue can be influenced by existing brand awareness.
Calculate incremental revenue attributed to Meta by subtracting holdout region performance from control region performance, normalized for population size. This number is Meta's true incremental contribution.
Run the reverse test separately, pausing PMax in the holdout while keeping Meta live, to measure PMax incrementality independently. Never pause both platforms simultaneously in a test region. Run tests during stable demand periods, not during major sales events or seasonality spikes.
Geo-holdout best practice: Use a 10-20% geographic holdout size to minimize revenue risk while achieving statistical significance within 2-4 weeks for accounts spending $50K or more per month combined.
Reading the Results: Is PMax Assisting Meta or Cannibalizing It?
Two outcomes are possible. Outcome A: PMax is additive. The control region with both platforms shows meaningfully higher new customer rate and MER than the holdout with one platform paused. This means you should increase PMax investment.
Outcome B: PMax is mostly cannibalistic. Control and holdout regions perform similarly, suggesting PMax is only capturing branded searches from users Meta already converted. Fix: reduce PMax brand campaign spend and redirect budget to Meta prospecting or to the non-brand PMax campaign.
A real scenario from agency testing: a DTC brand discovers 70% of PMax conversions are branded and non-incremental. They cut branded PMax spend by 40%, reinvest in Meta prospecting, and see MER improve from 2.8 to 3.4 within 30 days without any meaningful drop in total revenue.
Scaling Meta Ads Without ROAS Collapse: The Creative and Budget Playbook
Horizontal scaling is safer and more reliable than vertical budget increases because it tests incremental demand without forcing a single campaign into a higher-spend, higher-CPM environment prematurely. This is where most brands make the mistake of raising budgets before their creative library can support the additional reach.
Horizontal Scaling Before Vertical: The Duplication Method
Identify your best-performing Meta ad set by 7-day CPA and ROAS. Duplicate it into 3-4 variants: Broad, LAL 1% purchasers (180 days), LAL 3% purchasers, and a new geographic region if logistics allow. Run all variants at $50-$80 per day for 7 days without touching them.
After 7 days, kill the bottom 40% by CPA and double the budget on the top 40%. Repeat the process when the winners stabilize. This method expands reach and surfaces new audience pockets without inflating CPMs in a single ad set. Per Core PPC's Shopify scaling analysis, this duplication method consistently outperforms vertical budget increases alone at the $100K-$500K/month revenue stage.
Creative Cadence, Fatigue Signals, and the Hook-First Testing Method
Creative refresh cadence is the single most controllable lever on Meta. Accounts spending $300 or more per day that ship fewer than 2 new creatives per week see rising frequency-driven CPMs and CPA deterioration compared to accounts refreshing on cadence, per Meta guidance and agency testing.
Monitor two signals. First, 7-day frequency: refresh creative when frequency exceeds 3.5 on a 7-day window. A frequency above 3.5 is a reliable leading indicator of CPM increases and CPA deterioration in ecommerce Meta campaigns. Second, CPM: refresh when CPM spikes more than 20% above your 14-day average.
Test new hooks first. Change only the first 3 seconds of a video or the headline of a static before producing entirely new creative formats. A new hook costs a fraction of a new production and often produces 80% of the performance improvement. Maintain a log of every creative's launch date, spend, CPA, ROAS, and kill date to build a performance library over time.
Pro Tip: In 2026, the highest-performing Meta creative mix for DTC brands is at least 50% UGC or testimonial-style content and 50% produced demo or feature content. Brands that flip this ratio toward polished brand content at scale consistently see higher CPMs and lower conversion rates on cold audiences.
What Most DTC Brands Get Wrong Running Performance Max and Meta Ads Together
The mistakes are predictable and expensive. Understanding them before you scale saves you months of confused data and wasted budget.
The ROAS Dashboard Trap: Why Your Reporting Is Lying to You
Last-click platform ROAS dashboards are structurally unreliable for multi-platform DTC brands. Meta uses view-through and click attribution windows (1-day view, 7-day click by default). Google uses last-click. Both claim credit for the same conversion when a user sees a Meta ad and then later searches and clicks a PMax Shopping result.
Total reported ROAS across both platforms routinely exceeds actual business revenue by 30-60%. The fix is straightforward: use Shopify revenue as the single source of truth, calculate blended MER weekly, and treat platform ROAS as a directional signal only, not a decision-making metric. Platform ROAS tells you which direction performance is trending. MER tells you whether the business is actually profitable.
The Brand Cannibal Problem and How to Diagnose It
A brand cannibal PMax campaign is one where the algorithm optimizes toward cheap, easy branded conversions instead of prospecting new customers, giving the illusion of great ROAS while actually just capturing users Meta already converted.
Diagnose it by pulling the PMax search terms report and calculating what percentage of clicks and conversions come from branded queries (brand name, product name, site URL). If branded queries exceed 60-70% of PMax conversion volume, the campaign is mostly harvesting brand-aware users.
Fix it with structure: create separate Brand and Non-Brand PMax campaigns. Add brand term negatives to the non-brand campaign where Google's negative keyword tools allow. Monitor the non-brand campaign's share of new customer conversions monthly. A healthy PMax account should show meaningful non-brand search term volume. Accounts where 90% or more of PMax conversions are branded are functioning as expensive branded search campaigns, not prospecting tools.
Ignoring Retention: The Hidden Cost That Makes Scaling Impossible
Brands that scale Meta and PMax aggressively but have no email or SMS flows pay full CAC for every repeat buyer instead of converting them through Klaviyo at near-zero marginal cost. This is the hidden tax that makes profitable scaling feel impossible past a certain spend level.
The retention math is straightforward. A DTC brand with a 30% returning customer rate and a Klaviyo email and SMS program contributing 30% of total revenue can tolerate a higher blended CAC from Meta and PMax because repeat buyers arrive at near-zero marginal ad cost. Brands without this infrastructure pay full CAC for every order, including repeat buyers, which compresses the margin available for prospecting spend.
2024-2025 benchmarks show healthy DTC brands have email and SMS contributing 25-40% of total revenue. If yours is below 15%, fix retention before scaling ad budgets. DTC brands with email and SMS at 25-40% of revenue can sustain 20-30% higher paid CAC while maintaining the same contribution margin as brands without retention infrastructure.
The 2026 Shopify Implementation Checklist: Launching Performance Max and Meta Ads as One System
The Shopify-specific setup requirements must be completed before either platform can optimize effectively. Most brands skip at least one of these, then wonder why their campaigns underperform during the first 30 days.
Shopify Technical Setup for Both Platforms (Pre-Launch Checklist)
Meta Setup:
- Install Meta Pixel via the official Shopify app
- Activate Conversions API (server-side events) for purchase, add to cart, and initiate checkout events. Server-side event matching improves Meta's purchase event match quality score and reduces CPA by recovering conversions lost to iOS privacy changes and browser cookie restrictions.
- Upload customer purchase lists (minimum 1,000 emails) to Meta Custom Audiences
- Enable advanced matching in Meta Events Manager
Google Setup:
- Connect Shopify store to Google Merchant Center via the official Google and YouTube app
- Verify and claim your store URL in Merchant Center
- Submit your product feed and resolve all feed errors before launching campaigns
- Link Merchant Center to your Google Ads account
- Import Shopify purchase conversions into Google Ads as the primary conversion action
- Upload customer match lists to Google Ads. Note: Google Ads customer match requires a minimum of 1,000 matched users to function as audience signals in PMax. Below this threshold, audience signals have no meaningful effect on campaign targeting.
Shared Setup:
- Confirm Shopify analytics shows accurate revenue and order counts matching Google Analytics 4 before launching any paid campaigns. Discrepancies here will corrupt every optimization decision downstream.
Week-by-Week Launch Sequence for the First 30 Days
Week 1: Launch Meta Advantage+ Shopping Campaign and one manual broad ad set at conservative budgets ($100-$200/day total depending on revenue stage). Do not launch PMax yet. Let Meta gather purchase data and exit the learning phase without competition from PMax for conversion attribution.
Week 2: Review Meta learning phase exit. If 7-day CPA is within 20% of your target, launch the PMax Non-Brand campaign with in-market audience signals built from competitor URLs and category topics. Keep the PMax Brand campaign off for now.
Week 3: Review 7-day MER. If above your target band, launch the PMax Brand campaign and begin the weekly budget reallocation routine. You now have both platforms active and a system to manage them.
Week 4: Pull your first incrementality data point. Compare Shopify new customer acquisition rate week-over-week since PMax launched. If new customer rate increased alongside flat or improving MER, both platforms are working together. Adjust budgets per the MER framework.
Weekly and Monthly Operating Routine
Every Monday:
- Calculate 7-day blended MER (Shopify revenue divided by total ad spend)
- Check Meta creative frequency; refresh creative if above 3.5 on 7-day window
- Review PMax search terms for brand versus non-brand ratio
- Calculate new customer revenue versus total revenue in Shopify
- Adjust budgets per the 20% rule if MER is outside your target band
- Confirm at least 2 new Meta creatives are in flight or scheduled for the week
Every Month:
- Run or review incrementality test results (geo-split or holdout)
- Audit PMax asset group performance and update underperforming assets
- Review email and SMS revenue contribution in Klaviyo (target 25-40% of total revenue)
- Review 28-day new customer CAC versus 12-month LTV cohort. Healthy DTC scaling maintains new customer CAC at 30-40% of 12-month predicted LTV across the combined Meta and PMax stack.
- Update creative library with top-performing hooks and formats from the previous month
Frequently Asked Questions: Performance Max and Facebook Ads for Ecommerce
What is the difference between Performance Max and Facebook Ads?
Performance Max is a Google Ads campaign type that automatically serves ads across all Google inventory including Search, Shopping, YouTube, Display, Gmail, and Discover, optimizing toward conversions using machine learning. Facebook Ads (Meta Ads) is a paid social platform that interrupts users in their social feed on Facebook and Instagram to create demand and brand awareness. The key difference: PMax captures existing intent from people already searching or browsing, while Facebook Ads generate new intent by reaching cold audiences who have not yet searched for your product.
Can you run Performance Max and Meta Ads together?
Yes, and for most DTC Shopify brands in 2026, running Performance Max and Meta Ads together is the recommended strategy. Meta generates top-of-funnel demand by reaching cold audiences on social, while PMax captures the downstream intent that Meta creates when those users later search on Google or browse YouTube and Gmail. The key is managing both platforms by blended MER rather than chasing channel-specific ROAS, which will naturally shift between platforms as budgets scale.
Which is better for ecommerce, Google Ads or Facebook Ads?
Neither platform is categorically better for ecommerce. They serve different roles in the customer journey and work best together. Meta Ads excel at reaching cold audiences who have never heard of your brand and building purchase intent at scale, while Google Ads including Performance Max excel at converting users who already have purchase intent, especially those who saw a Meta ad and later searched for your product or category. Brands running both together consistently report 20-40% higher blended MER than brands relying on a single platform.
How do I split budget between Google and Meta ads?
The optimal budget split between Google and Meta depends on your revenue stage. Early-stage Shopify brands under $200K/month should allocate 60-70% of paid media budget to Meta and 30-40% to Google (PMax plus branded search), because Meta needs to build audience pools before PMax can optimize efficiently. Growth-stage brands at $200K to $1M per month typically stabilize near a 50/50 split, flexing between 40/60 and 60/40 based on 7-day marginal MER signals. The rule of thumb: if adding $1 to Meta returns more incremental revenue than adding $1 to PMax, shift the budget to Meta, and vice versa.
How do I track MER when using Performance Max and Facebook Ads at the same time?
To track blended MER across Performance Max and Facebook Ads, use Shopify as the single source of truth for revenue rather than relying on platform-reported conversion data. Calculate MER weekly by dividing total Shopify revenue for the period by total combined ad spend across Meta, Google, and any other paid channels. Platform ROAS dashboards double-count conversions when both Meta and PMax touch the same buyer journey, so blended MER based on Shopify revenue is the only reliable metric for cross-channel budget decisions. The target range for profitable DTC scaling is 2.5-4.0 per 2023-2025 agency benchmarks.
Scaling a Shopify brand past $200K/month in revenue requires treating performance max and Facebook ads as one coordinated system, not two separate campaigns you hope will coexist. The brands that win in 2026 are the ones managing by MER, testing incrementality, separating brand from non-brand in PMax, and refreshing Meta creative on a consistent weekly cadence.
If you want a team that has built and scaled this exact system across 40-plus DTC brands, Blue Water Marketing specializes in exactly this: Meta Ads, Google Performance Max, and Klaviyo retention working together as one growth engine for Shopify brands doing $50K to $5M per month. Book a strategy call to get a custom audit of your current paid stack.
Sources
Frequently Asked Questions
- What is the difference between Performance Max and Facebook Ads?
- Performance Max is a Google Ads campaign type that automatically serves ads across all Google inventory including Search, Shopping, YouTube, Display, Gmail, and Discover, optimizing toward conversions using machine learning. Facebook Ads (Meta Ads) is a paid social platform that interrupts users in their social feed on Facebook and Instagram to create demand and brand awareness. The key difference: PMax captures existing intent from people already searching or browsing, while Facebook Ads generate new intent by reaching cold audiences who have not yet searched for your product.
- Can you run Performance Max and Meta Ads together?
- Yes, and for most DTC Shopify brands in 2026, running Performance Max and Meta Ads together is the recommended strategy. Meta generates top-of-funnel demand by reaching cold audiences on social, while PMax captures the downstream intent that Meta creates when those users later search on Google or browse YouTube and Gmail. The key is managing both platforms by blended MER rather than chasing channel-specific ROAS, which will naturally shift between platforms as budgets scale.
- Which is better for ecommerce, Google Ads or Facebook Ads?
- Neither platform is categorically better for ecommerce. They serve different roles in the customer journey and work best together. Meta Ads excel at reaching cold audiences who have never heard of your brand and building purchase intent at scale, while Google Ads including Performance Max excel at converting users who already have purchase intent, especially those who saw a Meta ad and later searched for your product or category. Brands running both together consistently report 20-40% higher blended MER than brands relying on a single platform.
- How do I split budget between Google and Meta ads?
- The optimal budget split between Google and Meta depends on your revenue stage. Early-stage Shopify brands under $200K/month should allocate 60-70% of paid media budget to Meta and 30-40% to Google (PMax plus branded search), because Meta needs to build audience pools before PMax can optimize efficiently. Growth-stage brands at $200K to $1M per month typically stabilize near a 50/50 split, flexing between 40/60 and 60/40 based on 7-day marginal MER signals. The rule of thumb: if adding $1 to Meta returns more incremental revenue than adding $1 to PMax, shift the budget to Meta, and vice versa.
- How do I track MER when using Performance Max and Facebook Ads at the same time?
- To track blended MER across Performance Max and Facebook Ads, use Shopify as the single source of truth for revenue rather than relying on platform-reported conversion data. Calculate MER weekly by dividing total Shopify revenue for the period by total combined ad spend across Meta, Google, and any other paid channels. Platform ROAS dashboards double-count conversions when both Meta and PMax touch the same buyer journey, so blended MER based on Shopify revenue is the only reliable metric for cross-channel budget decisions. The target range for profitable DTC scaling is 2.5-4.0 per 2023-2025 agency benchmarks.